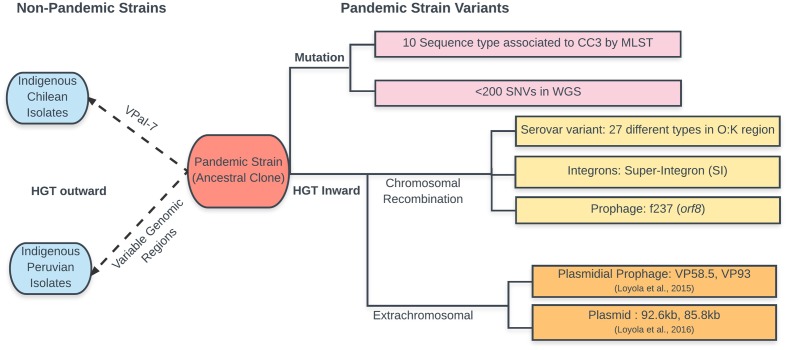
FIGURE 2.
Schematic representation of the changes observed during evolution of the pandemic V. parahaemolyticus clone. According to the text and data in cited references. Changes in the ancestral clone are shown to the left separating mutations from HGT. Transmission of pandemic strain genes to other indigenous V. parahaemolyticus (in blue) is shown to the right of the ancestral clone.

