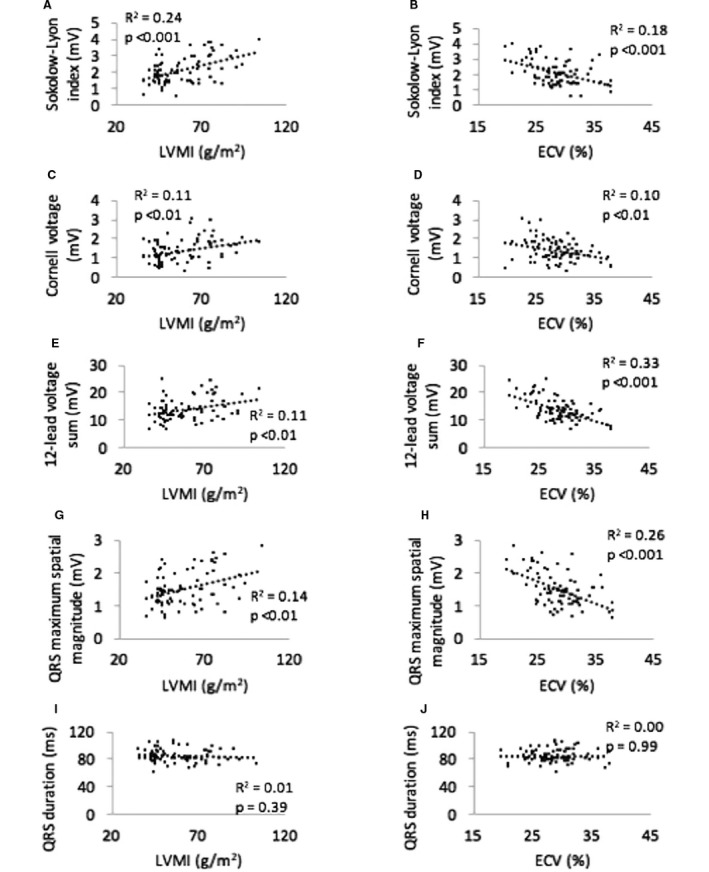
Figure 3.

Linear correlations between ECG measures and left ventricular mass index (LVMI) and extracellular volume fraction (ECV). Note that LVMI is positively correlated with ECG voltage, whereas ECV is negatively correlated with ECG voltage. QRS duration is not correlated with LVMI or ECV. Linear correlations between: A, Sokolow‐Lyon Index and LVMI; B, Sokolow‐Lyon Index and ECV; C, Cornell voltage and LVMI; D, Cornell voltage and ECV; E, 12‐lead voltage sum and LVMI; F, 12‐lead voltage sum and ECV; G, QRS maximum spatial magnitude and LVMI; H, QRS maximum spatial magnitude and ECV; I, QRS duration and LVMI and; J, QRS duration and ECV.
