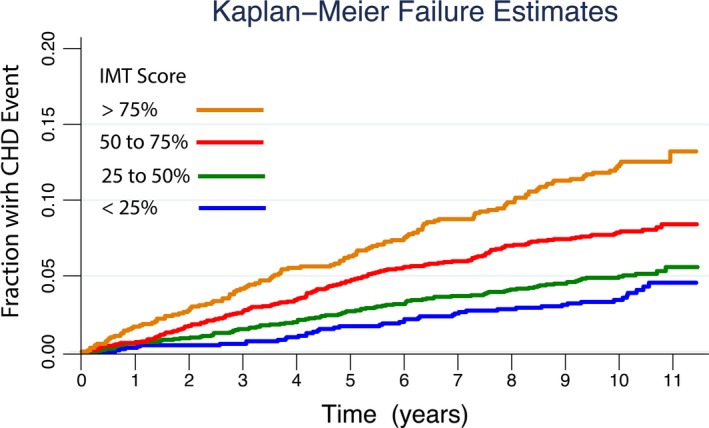
Figure 3.

Unadjusted Kaplan–Meier failure curves showing the increased cumulative incidence of coronary heart disease (CHD) by intima media thickness (IMT) score percentiles as a function of time since baseline IMT measurement. All participants were free of cardiovascular disease at baseline. The actual IMT percentile score cut points are shown in the legend and are scaled 0% to 100% instead of 0 to 1 for ease of interpretation.
