Figure 2.

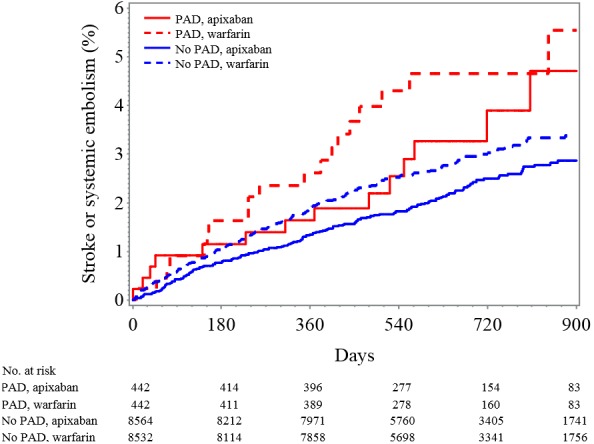
Kaplan–Meier plot for cumulative rate of stroke or systemic embolism in patients classified by PAD and treatment assignment. PAD indicates peripheral artery disease.

Kaplan–Meier plot for cumulative rate of stroke or systemic embolism in patients classified by PAD and treatment assignment. PAD indicates peripheral artery disease.