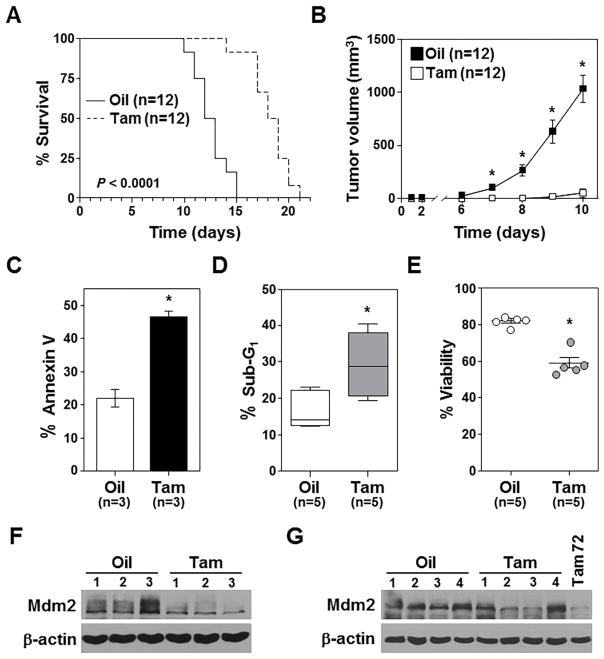
Figure 4. Mdm2 loss inhibits sarcoma growth in vivo.
A) Kaplan-Meier survival curves of mice (number indicated) injected (subcutaneously) with CreERT2 expressing Mdm2fl/flp53−/− sarcoma cells and administered tamoxifen (Tam) or vehicle (corn oil, Oil) control starting the day of cell injection (p<0.0001). B) Tumor volumes in mice in A measured at intervals (*p<0.00003). C–E) 72hrs following tamoxifen or vehicle control administration to mice, Annexin-V (C), sub-G1 DNA (D), and viability (E) were measured in extracted sarcoma cells. For D, whiskers represent the minimum and maximum, the line the median, and the box the 25th to 75th percentiles. C, *p=0.001; D, *p=0.012; E, *p<0.0001. F, G) Western blots of lymphomas harvested after 72hrs (F) or at humane endpoints (G) after tamoxifen (Tam) or vehicle control (Oil) administration. For G, a sarcoma harvested 72hrs after tamoxifen administration (Tam 72) included for comparison.

