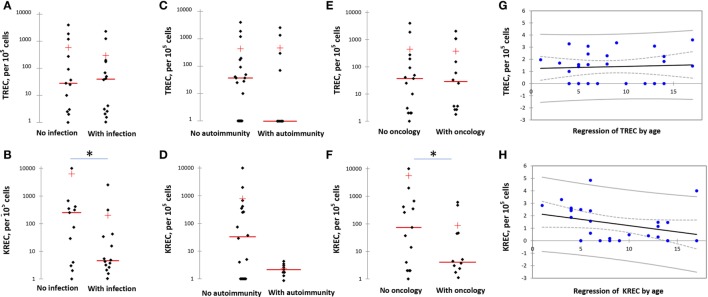
Figure 2.
T-cell excision circle (TREC) and kappa-deleting recombination excision circle (KREC) levels in various groups of Nijmegen Breakage Syndrome (NBS) patients. (A,B) TREC and KREC levels in NBS patients with and without infection. (C,D) TREC and KREC levels in NBS patients with and without autoimmune complications. (E,F) TREC and KREC levels in NBS patients with and without malignancies. (G,H) Age-dependent distribution of TREC and KREC levels in NBS patients. Asterisk indicates statistically significant difference between the groups. TREC/KREC levels are expressed per 105 cells. Note logarithmical scale of the graphs.

