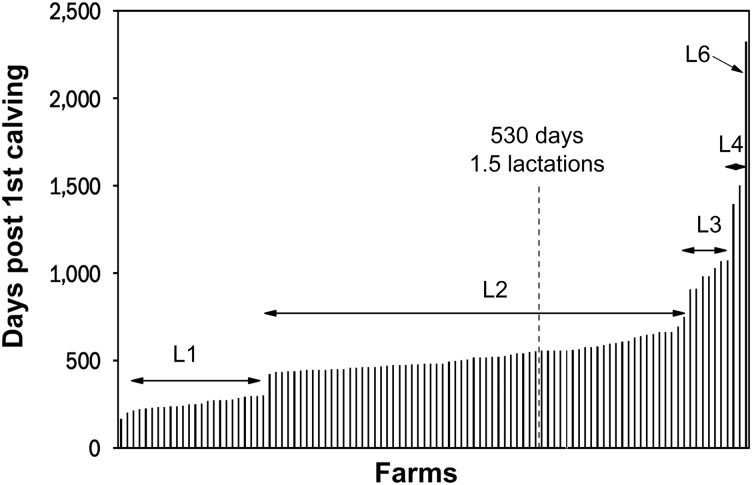
Figure 4.
Bar chart showing the number of days after first calving that heifers took to pay back their cost of rearing by lactation number, estimated for each of the 101 farms included in the study. The numbers above the bars (L1 to L6) represent the lactation number at which the breakeven point was reached. The mean time taken over all the farms was 530±293 days.

