
Figure 1.
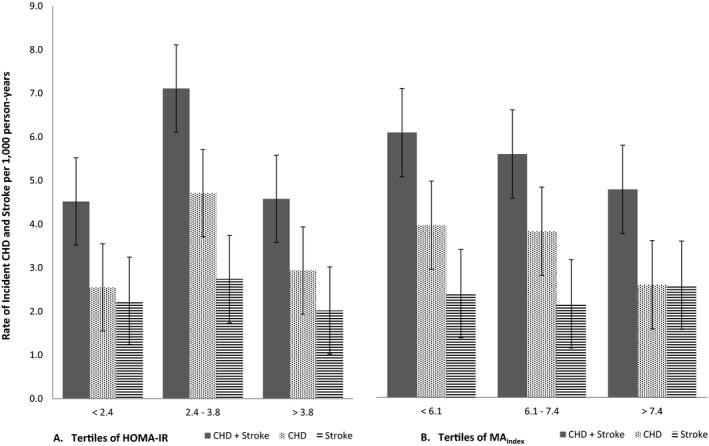
Rates of incident coronary heart disease and stroke. A, By tertiles of HOMA‐IR. B, By tertiles of the McAuley index. Numbers on the bars represent the actual rates of events (per 1000 person‐years). CHD indicates coronary heart disease; HOMA‐IR, homeostasis model assessment for insulin resistance; MA index, McAuley index.