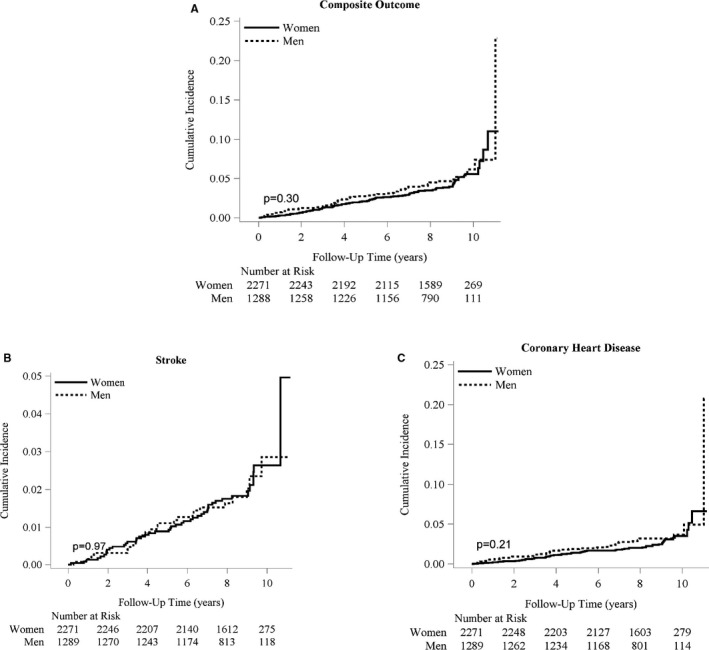
Figure 2.

Cumulative incidence functions for men and women. A, For the incident composite outcome of CHD and stroke. B, For incident stroke. C, For incident coronary heart disease. The solid line represents the cumulative incidence function curve for women, and the dashed line represents that for men. CHD indicates coronary heart disease.
