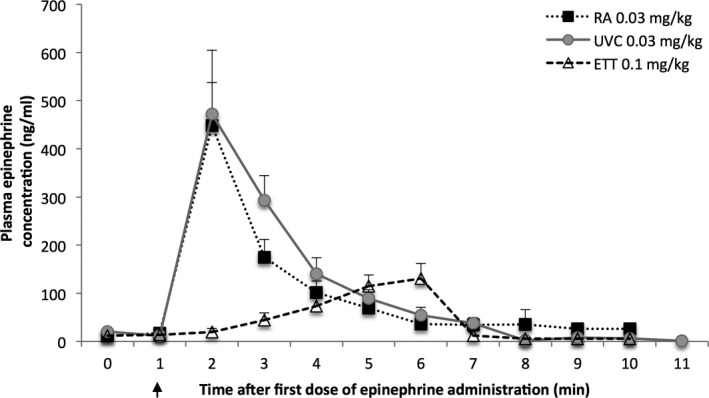
Figure 7.

Plasma epinephrine concentrations from lambs that received 1 dose of epinephrine. The precompression ETT and postcompression ETT groups were combined in this graph. Arrow indicates time of epinephrine administration. Data are mean±SEM. ETT indicates endotracheal tube; RA, right atrium; UVC, umbilical venous catheter.
