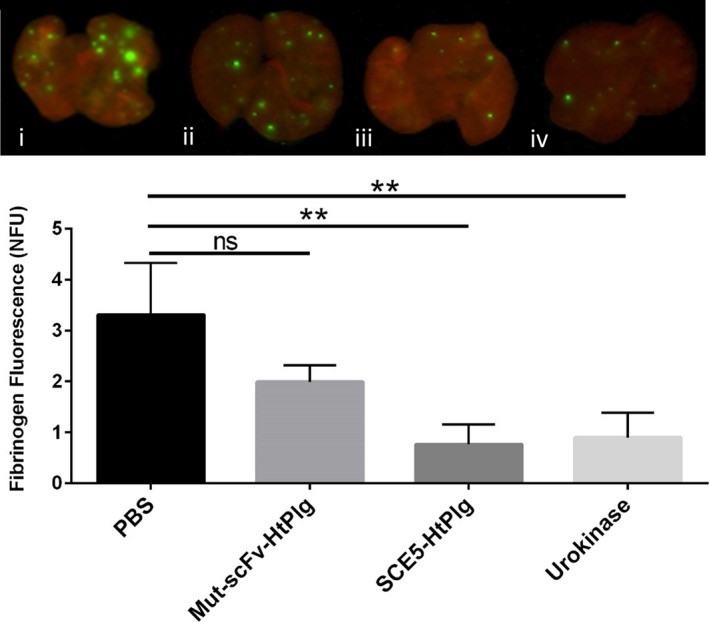
Figure 7.

In vivo fibrinolysis study in a mouse model of pulmonary embolism. Emboli were induced and fluorescently stained by infusing a mixture of Innovin (recombinant tissue factor and synthetic phospholipids) and Cy‐7–labeled fibrinogen. Four groups of drugs were injected 10 minutes after: PBS, nontargeted control scFv HtPlg (Mut‐scFv‐HtPlg; 4 μg/g body weight [BW]), anti–glycoprotein IIb/IIIa single‐chain antibody (SCE5)–human thrombin‐activatable microplasminogen (SCE5‐HtPlg; 4 μg/g BW), and urokinase (500 U/g BW). Mice were sacrificed 50 minutes after drug administration, perfused with PBS, and lungs were harvested and scanned using an Odyssey Infrared Imaging System (700 nm channel shown in red, 800 nm channel shown in green). Fibrinogen fluorescence is measured and presented as a mean value of normalized fluorescence units (mean±SEM, n=3, not significant [ns], **P<0.01).
