
Figure 1.
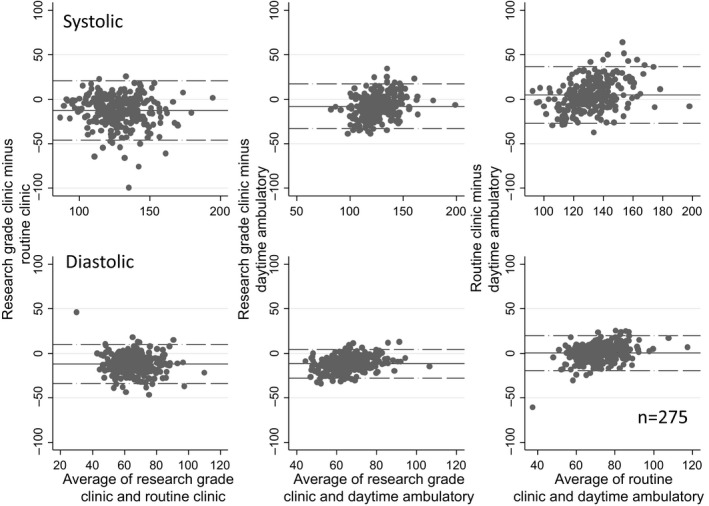
Bland–Altman plot showing the mean differences between various blood pressure (BP) recordings and their limits of agreement. The top panel shows systolic BP and the bottom panel shows diastolic BP. Research‐grade BP was, on average, 12.7/12.0 mm Hg lower (bias) than routine clinic BP and had wide limits of agreement.