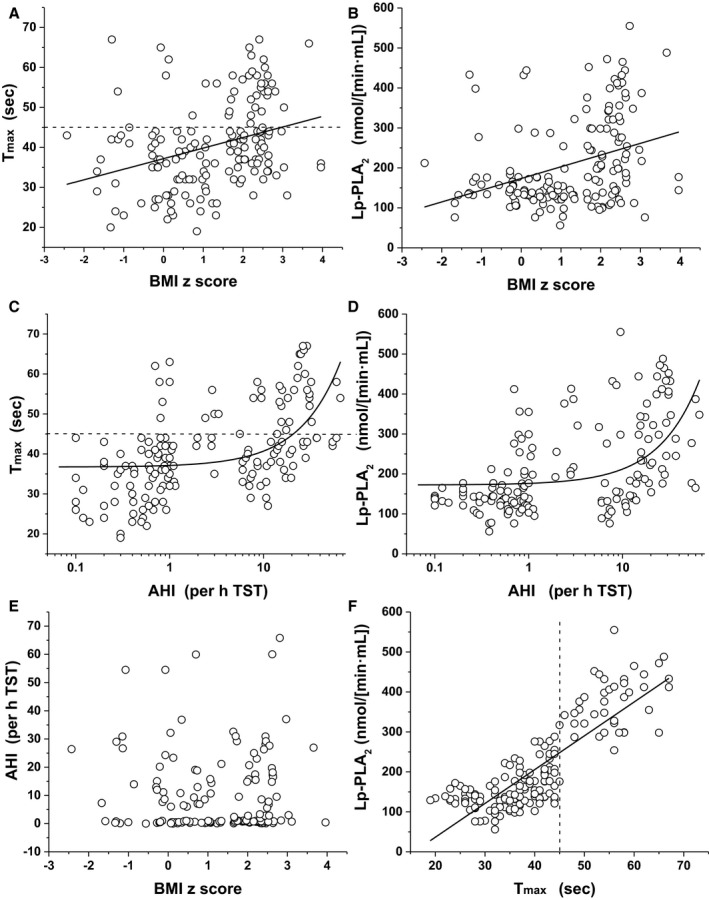
Figure 1.

Scatterplots of Lp‐PLA2 plasma activity levels, BMI z‐score, obstructive apnea hypopnea index (AHI), and Tmax in children with and without obesity or OSA. A, Tmax vs BMI z‐score: r=0.319, P<0.001. B, Lp‐PLA2 vs BMI z‐score: r=0.350, P<0.001. C, Tmax vs AHI: r=0.489, P<0.001. D, Lp‐PLA2 vs AHI: r=0.483, P<0.001. E, AHI vs BMI z‐score, not significant. F, Lp‐PLA2 vs Tmax: r=0.837, P<0.001. Actual values rather than log‐transformed values were used in the linear fitting functions shown. AHI is displayed as log scale (C and D). Dotted lines indicate the cutoff used to define endothelial dysfunction, ie, Tmax >45 seconds. AHI indicates apnea hypopnea index; BMI, body mass index; Lp‐PLA 2, lipoprotein‐associated phospholipase A2; Tmax, time to peak reperfusion; TST, total sleep time.
