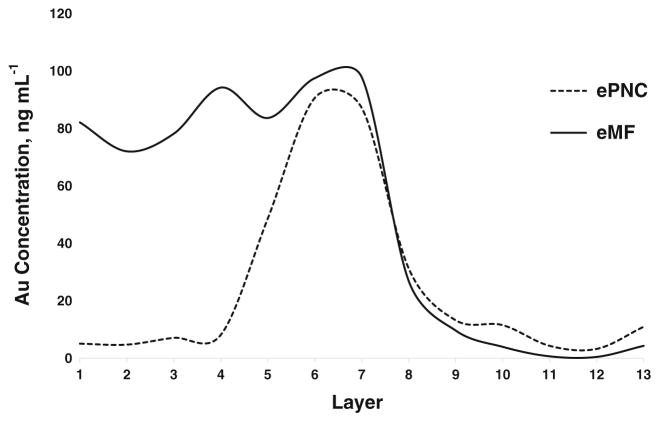
Fig. 1.
Distribution of gold across the layers of the sucrose density gradient for Mixture 1 containing 30, 60, and 100 nm AuNPs by conventional ICP-MS after 20 min of centrifugation. Total gold content in individual 1 mL aliquots are plotted from the top of the conical tube to the bottom in the eMF (solid line) and ePNC (dotted line) conditions, respectively

