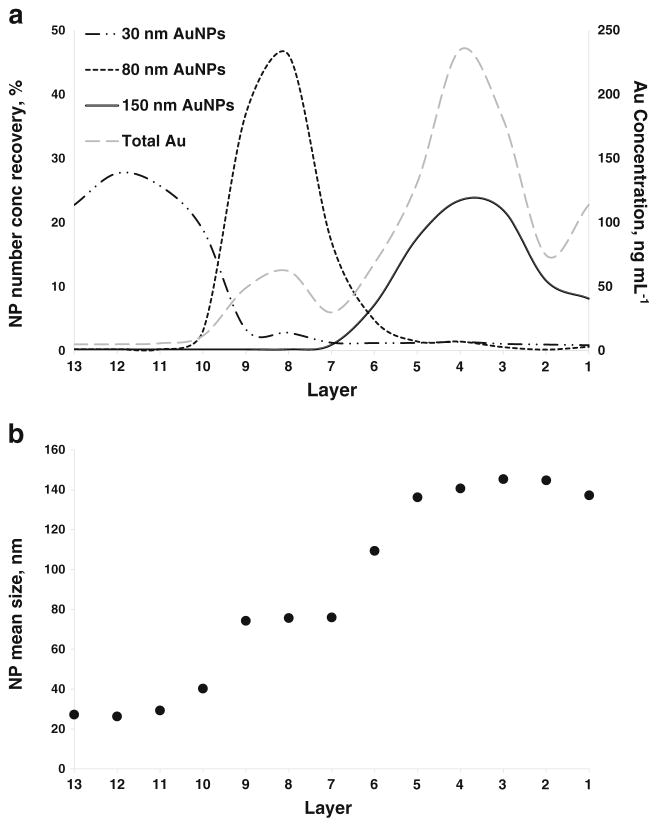
Fig. 4.
a AuNP number concentration recovery of the components of Mixture 3 across layers of the sucrose density gradient in the ePNC condition by spICP-MS. Long dash dotted line corresponds to 30 nm AuNPs, dotted line plots the 80 nm AuNPs and the solid line reflects the 150 nm AuNPs. The gray dashed line and the secondary axis correspond to the distribution of gold obtained by conventional ICP-MS. b Mean AuNP size in each layer measured using spICP-MS

