
Figure 1. Obese Phenotypes in Rap1-Deficient Mice.
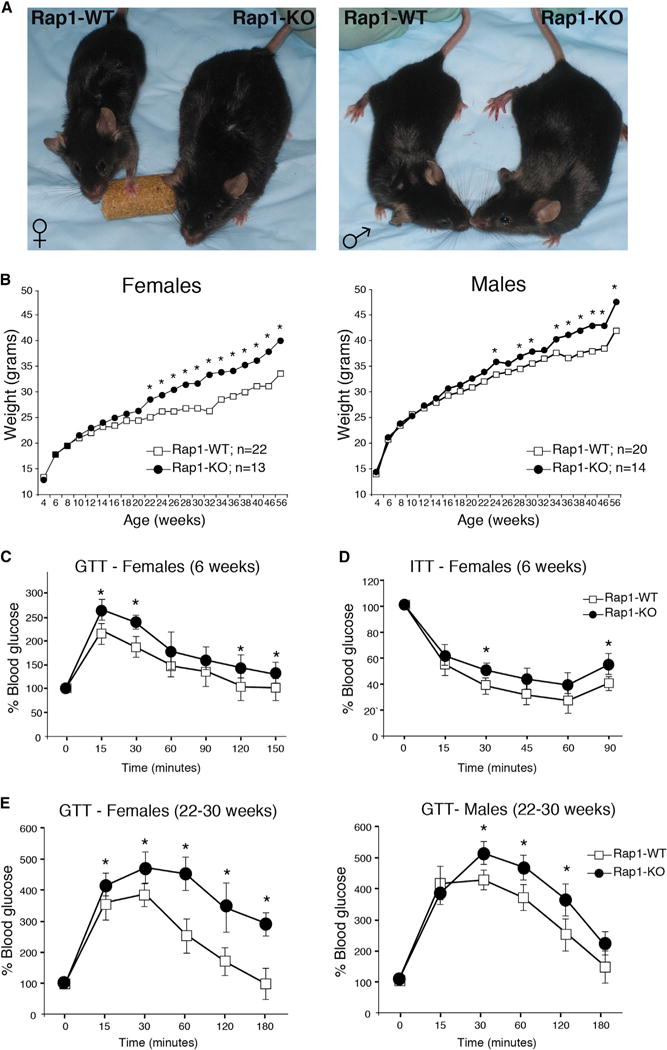
(A) Rap1-KO mice display morphological signs of obesity when compared to Rap1-WT controls. Shown are representative photographs of 24-week-old female (left) and male (right) mice.
(B) Body-weight curves of Rap1-WT (white boxes) and Rap-KO (black circles) mice over a period of 56 weeks. Animals were fed a normal chow diet and weighed once every 2 weeks. Data represent mean value, and p values were calculated with the Student’s t test (*p < 0.05).
(C) Plasma glucose levels during glucose tolerance test (GTT) performed on 6- to 8-week-old female mice. Closed circles represent Rap1-KO mice (n = 5) and open boxes represent WT control mice (n = 5). Values were normalized to t = 0 time point. Data represent mean ±SEM. All p values were calculated with the Student’s t test (*p < 0.05).
(D) Plasma glucose levels during Insulin tolerance test (ITT) performed on 6-8 week-old female mice (n = 5 for each group). p values were calculated by Student’s t test and (*) indicates p < 0.05.
(E) GTT performed on 24–32 week-old females (right panel) and males (left panel) mice. Closed circles represent Rap1-KO mice (n = 15 for females and n = 14 for males) and open boxes represent WT control mice (n = 18 for females and n = 20 for males). Data represent mean ±SEM. All p values were calculated with the Student’s t test (*p < 0.05).