
Figure 2. White Adipose Tissue Dysregulation in the Absence of Rap1.
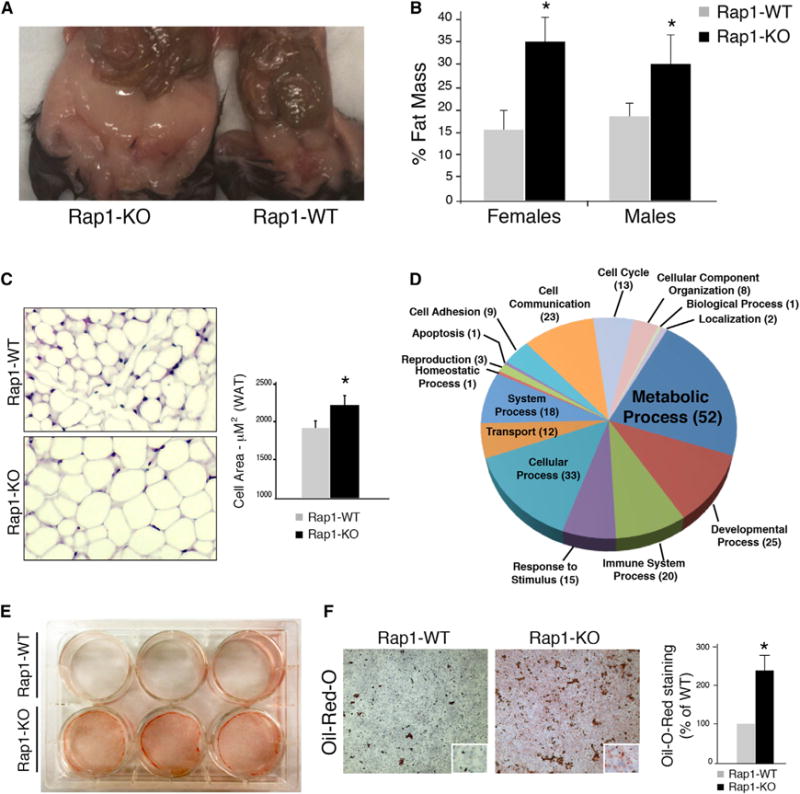
(A) Representative photograph of 40-week-old Rap1-KO (left) and Rap1-WT (right) female mice displaying WAT accumulation.
(B) A DEXA scan was performed on 24- to 32-week-old Rap1-WT mice. Fat percentage is represented as average values ±SEM. The Student’s t test was performed for significance and (*p < 0.05).
(C) Shown are representative sections of intra-abdominal WAT from 6-week-old Rap1-WT and Rap1-KO mice stained with H&E. Morphometric analysis of white fat cells was carried out using MetaMorph. Cell area was quantified for each genotype and values represent mean ±SEM.
(D) Gene Ontology analysis was performed to classify differentially expressed genes from intra-abdominal WAT of 6-week-old Rap1-KO and Rap1-WT female mice into biological processes.
(E) Transdifferentiation of MEFs isolated from Rap1-KO and Rap1-WT mice into adipocytes. Lipid accumulation is visualized using oil red O staining.
(F) Shown is a representative image of a transdifferentiated adipocyte stained with oil red O. Lipid accumulation was quantified and normalized to WT levels. Values are mean ±SEM. A Student’s t test was performed for significance and (*p < 0.05).