Figure 3.
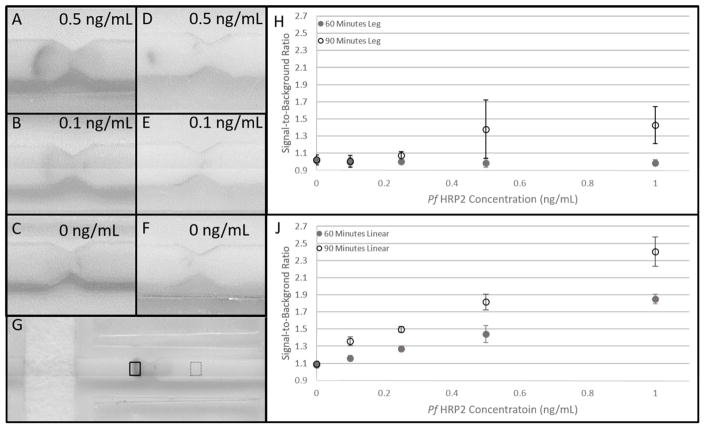
Results of Pf HRP2 2DPN assays. Representative scanned image for the linear device of (A) 0.5 ng/mL Pf HRP2. (B) 0.1 ng/mL and (C) 0 ng/mL after 90 minutes. Representative scanned images for the leg device are shown in (D), (E) and (F) for the same concentrations. (G) Signal and background regions-of-interest. The solid black box corresponds to the signal region-of-interest and the dotted black box to the background region-of-interest. (H) A plot of the signal-to-background ratio for the leg 2DPN for concentrations ranging from 0 to 1 ng/mL Pf HRP2 at 60 and 90 minutes after assay initiation. Each data point corresponds to the average of three separate tests. There is no significant difference in mean SBR between any antigen concentration at 60 or 90 minutes. (J) Presents the same plot for the linear 2DPN. At 60 minutes, there is no significant difference between 0.1 ng/mL and 0 ng/mL or between 0.5 ng/mL and 0.25 ng/mL. The mean SBR is significantly different between all other antigen concentrations. At 90 minutes, the mean SBR is significantly different between all antigen concentrations.

