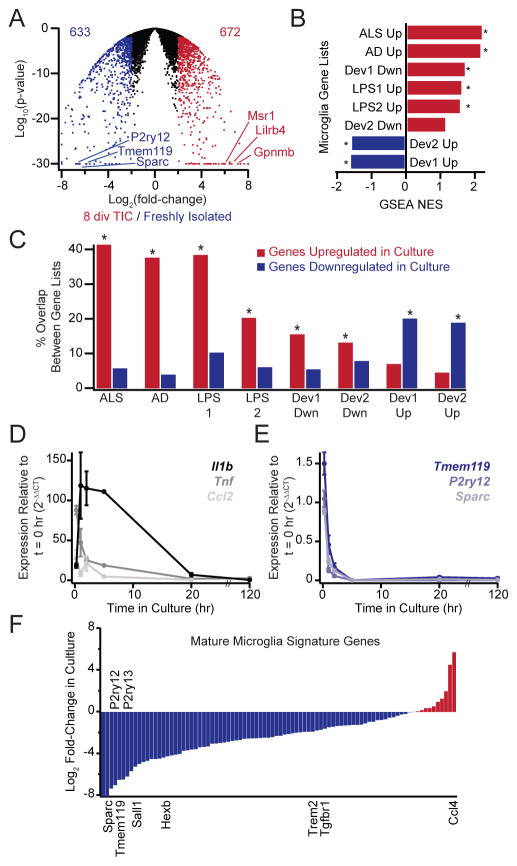
Figure 6. Transcriptional profiling indicates microglial de-differentiation in culture.
(A) Volcano plots summarizing changes in microglial gene expression (P21, 8 div in TIC) compared to freshly isolated cells. Values in the upper corners denote the number of genes upregulated (red) or downregulated (blue) in cultured cells (4-fold cutoff at P < 0.01). (B) GSEA comparison of culture-induced gene changes with developmental or inflammatory gene changes. The nominal enrichment score (NES) for each comparison is shown, with positive values (red) indicating enrichment among genes upregulated in culture and negative values (blue) indicating enrichment among genes downregulated in culture. Cultured microglia upregulate genes associated with microglia in neurodegeneration (ALS or AD mouse models) peripheral inflammation (LPS) and early development (developmentally downregulated genes, Dev Dwn), but they downregulate genes associated with maturation (developmentally upregulated genes, Dev Up). *Both FDR q-value and nominal P-value < 0.001. (C) Overlap between genes changing in inflammation/development and genes upregulated (red) or downregulated (blue) in culture. Percent overlap denotes the fraction of genes in each developmental or inflammation gene list that are also up- or down-regulated in culture. Culture-induced gene expression changes partially recapitulate inflammatory changes and demonstrate an inverse relationship to developmental changes. *P < 0.001 hypergeometric distribution. (D, E) QPCR shows rapid but transient upregulation of canonical activation markers accompanied by rapid and sustained downregulation of microglial signature genes over the first 5 days in culture (P19–P21, in TIC). (F) Log2 fold-changes in RNA-seq FPKM values measured for cultured microglia relative to freshly isolated cells for 88 genes that are both upregulated developmentally and preferentially expressed by microglia over other tissue macrophages. The majority of microglial signature genes are downregulated (blue), not upregulated (red) in culture. Averages are mean ± sem.

