
Fig. 4.
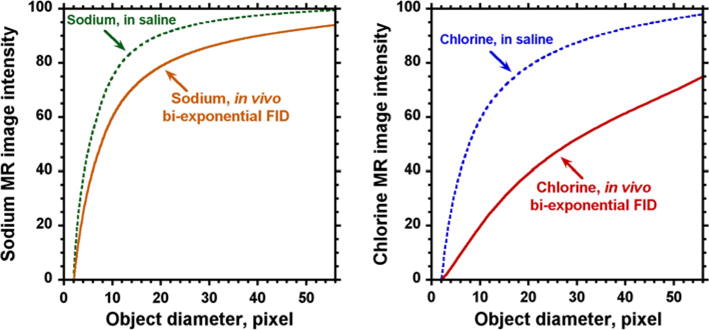
3D model of the effect from bi-exponential FID, and small acquisition matrix size on the image intensity for sodium and chlorine MRI. X-axis shows the diameter of a spherical object in pixels for the field of view covered by 64 pixels. Y-axis represents the average intensity inside the object relative to the reference which had the size covered by matrix of 56 × 56 × 56 voxels. The upper curves demonstrate a partial volume effect on image intensity for the saline test sample. The lower curves represent additional contributions occurring due to the bi-exponential decay of the FIDs in vivo for sodium and chlorine. The model shows a dramatic effect of both effects for chlorine MRI. The shapes of the chlorine and sodium bi-exponential functions were taken from the corresponding FIDs acquired in this study from a whole rat head