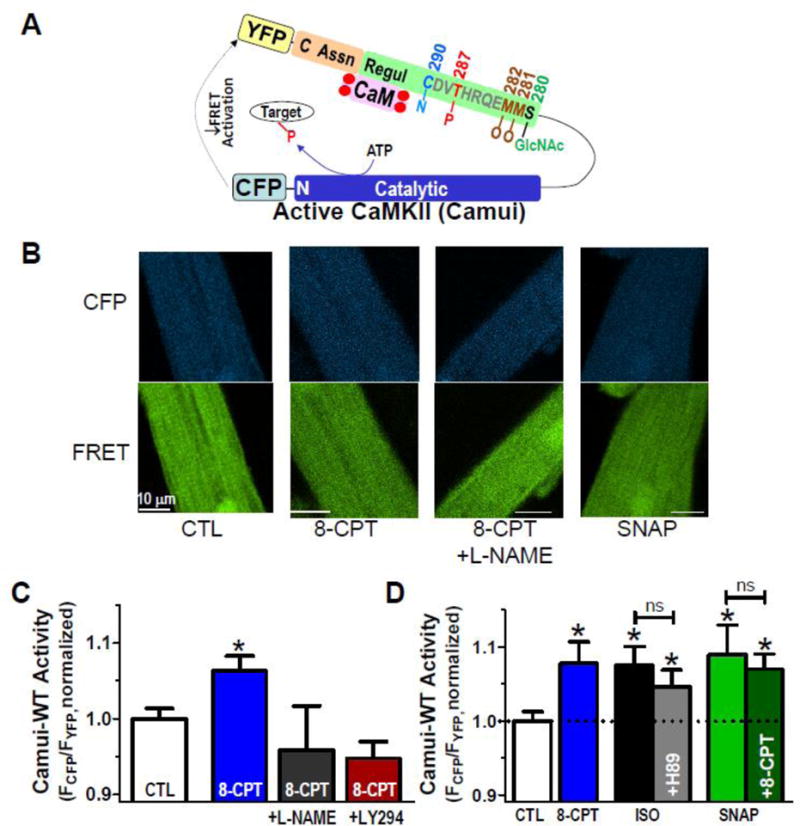
Figure 5. CaMKII activation via Epac.

A. Schematic of the FRET-based activity reporter Camui, where activation (opening of regulatory (Regul) and catalytic domains causes reduced FRET between cyan and yellow fluorescent proteins (CFP and YFP). Sites of autophosphorylation (P), S-nitrosylation (N), oxidation (O) and O-GlcNAcylation (GlcNAc) are indicated. B. Rabbit myocyte images of CFP and FRET (YFP emission) under indicated treatments. C. Mean Camui signals at baseline (CTL), with 10 μM 8-CPT alone (30 min) or after pretreatment with 100 μM L-NAME or 10 μM LY294002 (n=41, 44, 13 and 10, respectively). D. Mean Camui signals in control rabbit cardiomyocytes at baseline (CTL), ± 10 μM 8-CPT (30 min), ISO (100 nM) ± H89 (1 μM) or SNAP ± 8-CPT (n =33, 24, 13, 17, 18 and 14 for each bar, respectively).
