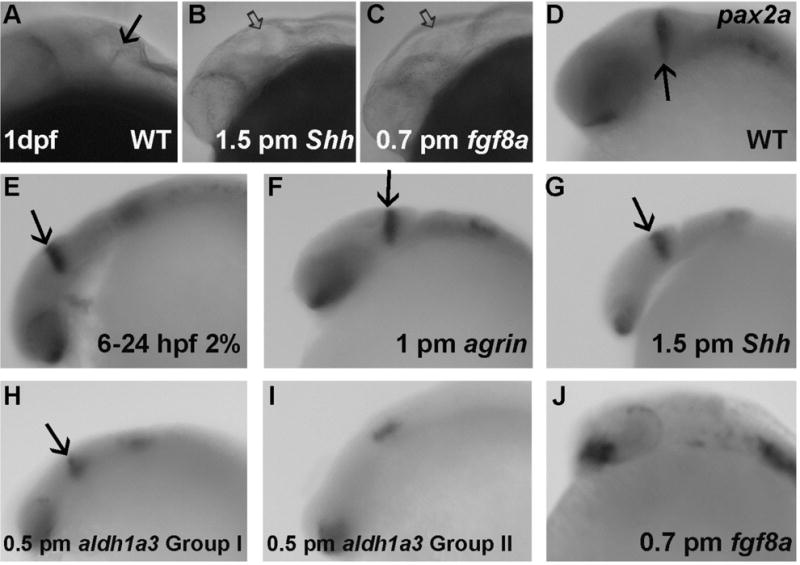
Figure 5. Analysis of pax2a gene expression in ethanol and MO treated embryos.

A–C, MHB morphology following shh and fgf8a MO treatment; D–J, WISH of pax2a expression. D, WT; E, embryo exposed to 2% ethanol from 6–24 hpf; F, embryo exposed to 1 pmol agrin MO; G, embryo injected with 1.5 pmol shh MO; H–I, embryos injected with 0.5 pmol aldh1a3 MO, either showing normal pax2a expression (H) or loss of MHB pax2a expression (I); J, embryo injected with 0.7 pmol fgf8a MO; All embryos are lateral views. Solid arrows indicate the morphologically normal MHB or pax2a expression in MHB. The open arrows indicate a morphologically abnormal MHB. Note that MHB morphology was disrupted in B–C and pax2a expression in MHB was lost in I and J.
