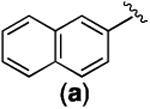
Table 1.
Antiproliferative activities (GI50, μM) of compounds 2 and 4 in breast cancer cells.a
| -R | MDA-MB-231 | MDA-MB-468 | ||
|---|---|---|---|---|
|
| ||||
| Series 2b | Series 4 | Series 2b | Series 4 | |

|
1.60 ± 0.51 | 0.20 ± 0.17 | 0.44 ± 0.14 | 0.088 ± 0.026 |
| Me (b) |
27.17 ± 11.40 | >100c | 53.54 ± 29.54 | >100c |
| Et (c) |
21.43 ± 9.86 | 72.84 ± 5.64 | 24.41 ± 3.33 | 28.30 ± 7.05 |
|
n-Pr (d) |
25.52 ± 9.93 | 3.46 ± 1.46 | 27.37 ± 4.52 | 2.02 ± 1.10 |
|
i-Pr (e) |
39.66 ± 22.46 | >100c | 29.80 ± 8.41 | >100c |
|
t-Bu (f) |
N/Ad | >100c | N/Ad | >100c |
The antiproliferative activities of the compounds were assessed using the MTT assay. The cells were incubated with different concentrations of the drugs for 72 h. Then the number of viable cells was quantified by the MTT reagent. The GI50s, presented as mean ± SD (standard deviation), were calculated from the corresponding dose-response curves in Prism 5.0 using non-linear regression analysis. The SD was calculated from at least two independent measurements.
The GI50s for series 2 were from ref10.
The GI50 was not reached at the highest tested concentration (100 μM).
This compound was not assessed.
