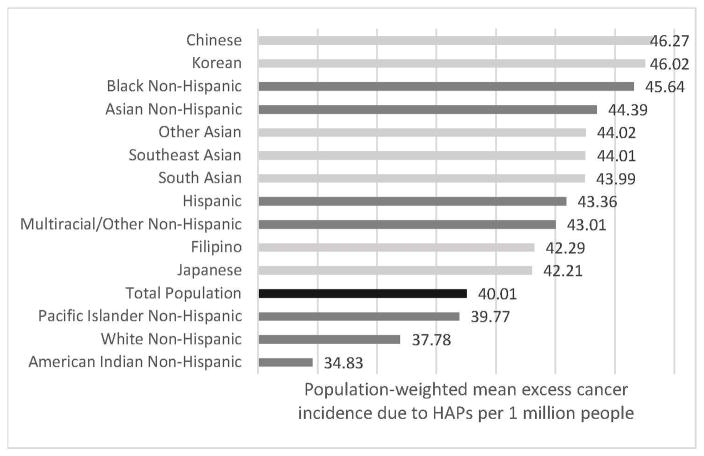
Figure 3.
Population-weighted estimated mean excess cancer incidence due to HAPs by racial/ethnic and Asian ancestry group in the US, 2011
Note: The black bar represents the national average. Dark gray bars represent broad racial/ethnic classifications and light gray bars represent Asian ancestry groups.

