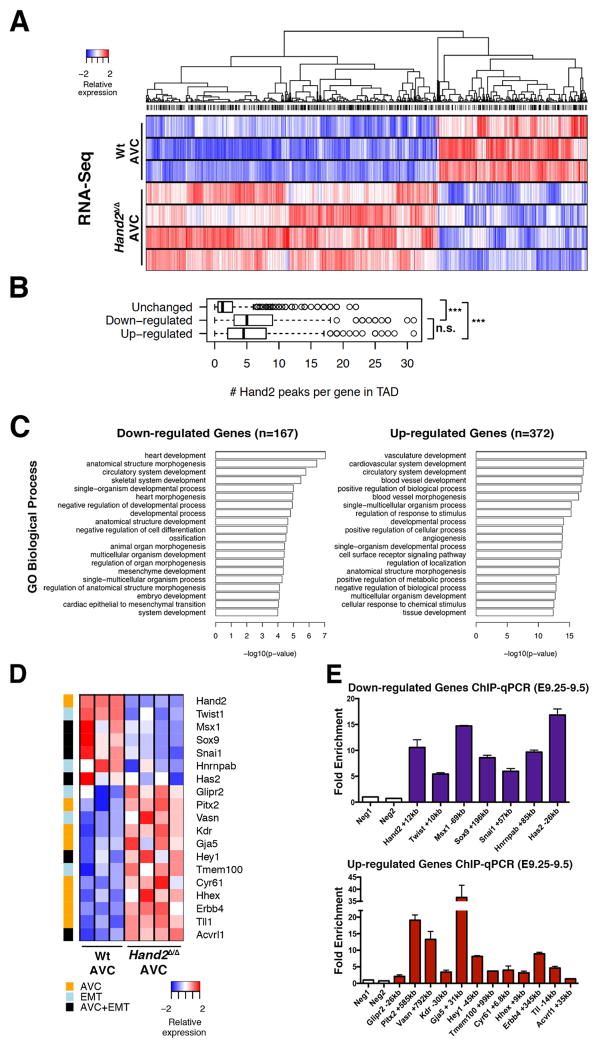
Figure 4. Transcriptome analysis identifies the transcriptional targets of HAND2 in the AVC.
(A) Heat map of the differentially expressed genes (DEGs) identified by comparing the transcriptomes of wild-type and Hand2-deficient AVCs from mouse embryonic hearts at E9.25–E9.5 (n=4 and n=3 biological replicates were analyzed for mutant and wild-type AVCs, respectively). DEGs are genes whose expression is significantly changed (≥1.5-fold) between wild-type and mutant samples (p<0.05) (B) The box plot shows the number of HAND2 ChIP-Seq peaks in the TADs harboring genes with unchanged, down- or up-regulated expression in mutant AVCs, respectively. The TADs of genes with altered expression encode more HAND2-interacting genomic regions. To account for the different numbers of genes and HAND2 ChIP-Seq peaks per TAD, peak counts were normalized as numbers of peaks per gene for each TAD. (C) GO enrichment analysis for biological processes for the 167 down-regulated and 372 up-regulated genes (in mutant AVCs) that contain HAND2 ChIP-Seq peaks in their TADs. (D) GO analysis to identify the HAND2 target genes with annotated functions in EMT processes and AV cushion morphogenesis. (E) Mouse embryonic hearts isolated at E9.25–E9.5 were used for ChIP-qPCR validation of the most prominent HAND2 ChIP-Seq peaks in the TADs of the genes shown in panel D (n=4 using two biological replicates, p≤0.05). See also Figure S4 and Table S5 and S6.

