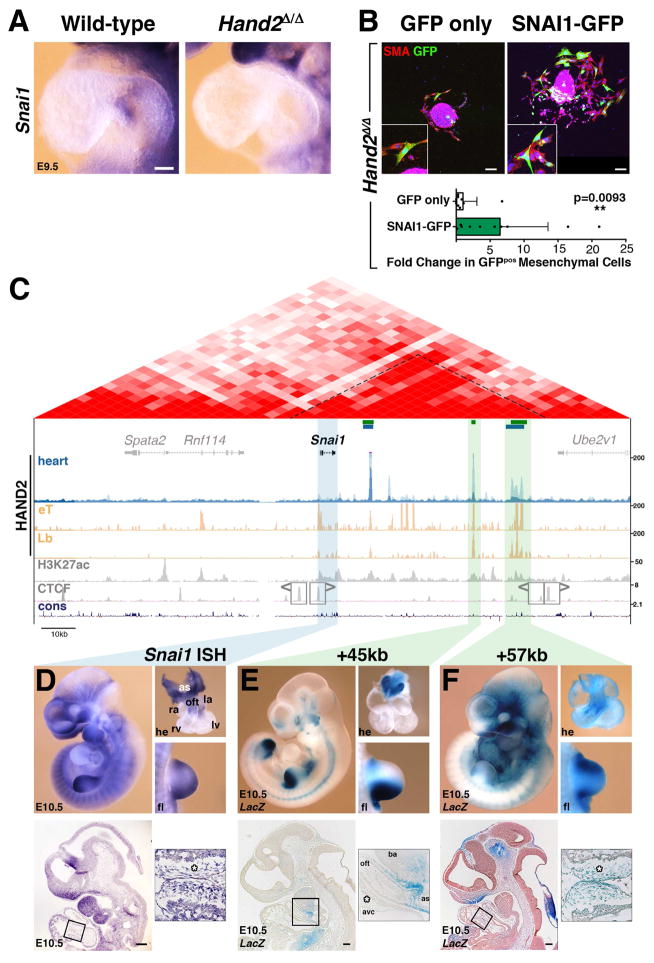
Figure 6. Re-expression of Snai1 in Hand2-deficient AVC explants partially restores mesenchymal cell migration and regulation of Snai1 expression by enhancers enriched in HAND2 chromatin complexes.
(A) Snai1 expression is lost from the endocardium of Hand2-deficient hearts. (B) Upper panels: Hand2-deficient AVC explants were infected either with GFP (control) or SNAI1-GFP adenovirus to re-express SNAI1Smaples were analyzed 72 hours after infection. All infected cells that migrated into the matrix are marked by GFP expression (green). Smooth muscle actin (SMA, red) was detected to reveal cellular morphology. Lower panel: Quantitation of cell migration in Hand2-deficient AVC explants. The mean ±SD and all individual data points are shown. The observed increase in mesenchymal cells in SNAI1-GFP infected explants is significant (p= 0.0093, Mann-Whitney test). Scale bars: 100μm. (C) Scheme of the mouse Snai1 TAD (red, HiC-data). The HAND2 ChIP-Seq profiles in the heart (this study), Hand2-expressing tissues (eT) and limb buds (Lb(Osterwalder et al., 2014) are shown below together with the H3K27ac profile in developing hearts (E11.5, Nord et al., 2013). The Snai1 TAD boundaries are marked by CTCF-binding regions in opposite orientation (Gomez-Marin et al., 2015). Green bars indicate the HAND2 target CRMs located +14kb, +45kb and +57kb that were analyzed by LacZ reporter assays in transgenic founder embryos. (D) Snai1 transcript distribution in wild-type mouse embryos (E10.5). (E, F) representative transgenic founder embryos (E10.5) show the activity of LacZ reporter constructs encoding the +45kb and +57kb CRMs, respectively. The upper panels depict whole embryos, dissected hearts and forelimb buds. The lower panels show sagittal sections at the level of the heart. The boxed areas indicate the enlargements shown in the right panels. Asterisks: AVC cardiac cushion mesenchyme; as: aortic sac; avc: atrioventricular canal; ba: branchial arch; la: left atria; lv: left ventricle; oft: outflow tract; ra: right atria; rv: right ventricle. Scale bars: 200μm. See also Figure S5 and S6.

