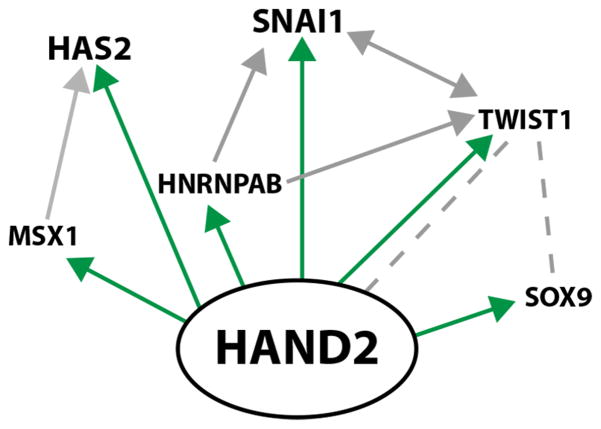
Figure 7. Scheme depicting the interactions among positively regulated HAND2 targets genes.
The HAND2 GRN was constructed using Ingenuity pathway analysis in combination with manual annotation (Chen et al., 2008). Arrows indicate transcriptional up-regulation and direct up-regulation by HAND2 transcriptional complexes is indicated in green. Broken grey lines direct protein-protein interactions. This graph represents the simplest possible scheme to illustrate the relevant direct interactions.

