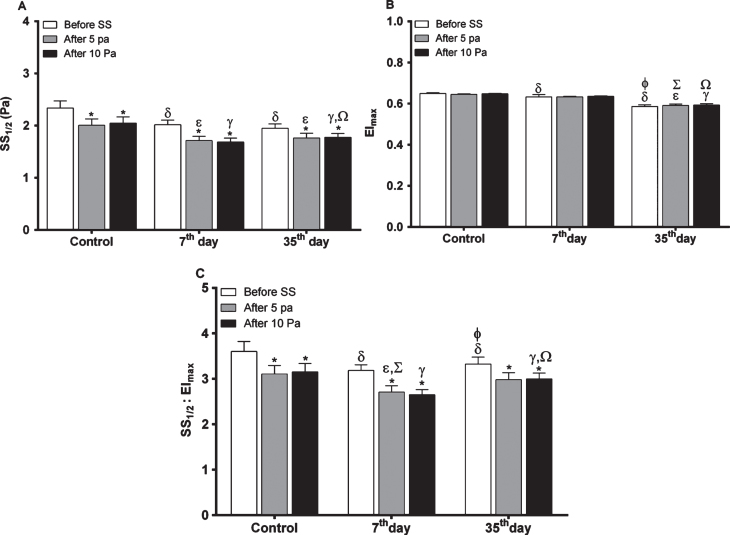
Fig.1.
The levels of EImax, SS1/2 and SS1/2/EImax values in all studied samples (n = 11 in each group) before and after continuous SS. (A) SS1/2 levels in each group before and after continuous shear stress (SS). (B) EImax levels in each group before and after continuous shear stress (SS). (C) SS1/2/EImax levels in each group before and after continuous shear stress (SS). Significance between before and after SS in each group: *p≤0.05, significance of control group with 7th and 35th day groups before SS: δp≤0.05, significance of control group with 7th and 35th day groups after 5 Pa SS: ɛp≤0.05, significance of control group with 7th and 35th day groups after 10 Pa SS: γp≤0.05, significance between 7th and 35th day groups before SS: φp≤0.05, significance between 7th and 35th day groups after 5 Pa SS: Σp≤0.05, significance between 7th and 35th day groups after 10 Pa SS: Ωp≤ 0.05.

