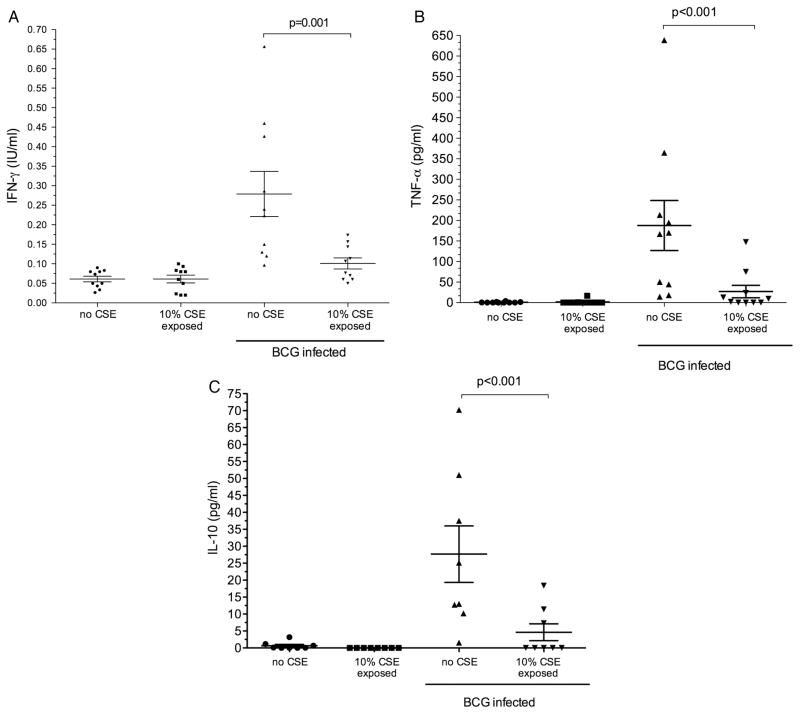
Figure 2.
Cytokine production at 18 h by monocyte-derived macrophages with and without exposure to cigarette smoke extract (CSE). Each plot represents cytokine production by monocyte-derived macrophages from individual donors. The mean and (SEM) is represented by the horizontal line and error bars. Cells were exposed to BCG for 18 h (BCG-infected); (A) interferon γ (IFN-γ; n=10); (B) tumour necrosis factor α (TNF-α; n=10); (C) interleukin 10 (IL-10; n=8).

