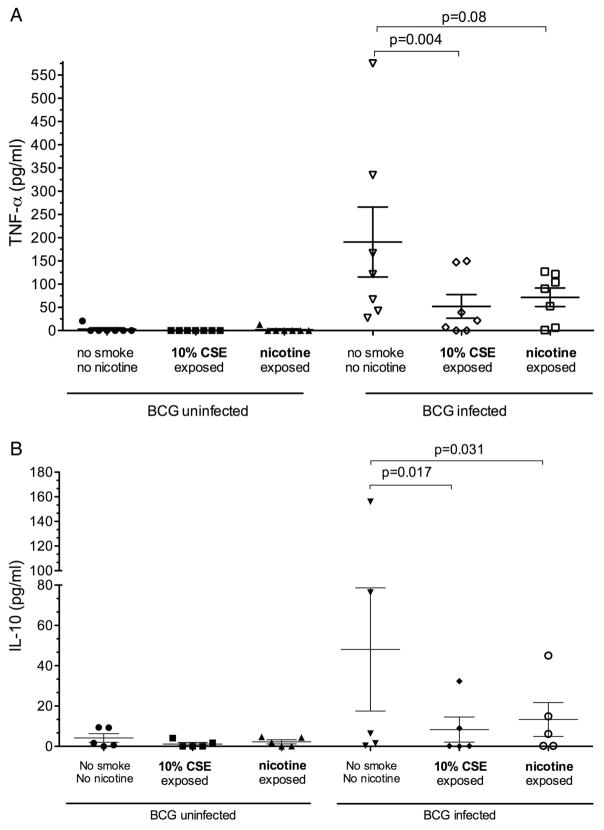
Figure 3.
Effect of nicotine on cytokine production by monocyte-derived macrophages. Each scatter plot represents cytokine production by monocyte-derived macrophages unexposed or exposed to cigarette smoke extract (CSE) or nicotine, and uninfected (left hand panel) or following an 18 h BCG infection (right; BCG-infected). The horizontal bars represent mean (SEM) values. (A) Tumour necrosis factor α (TNF-α) responses (n=7). (B) Interleukin 10 (IL-10) responses (n=5).

