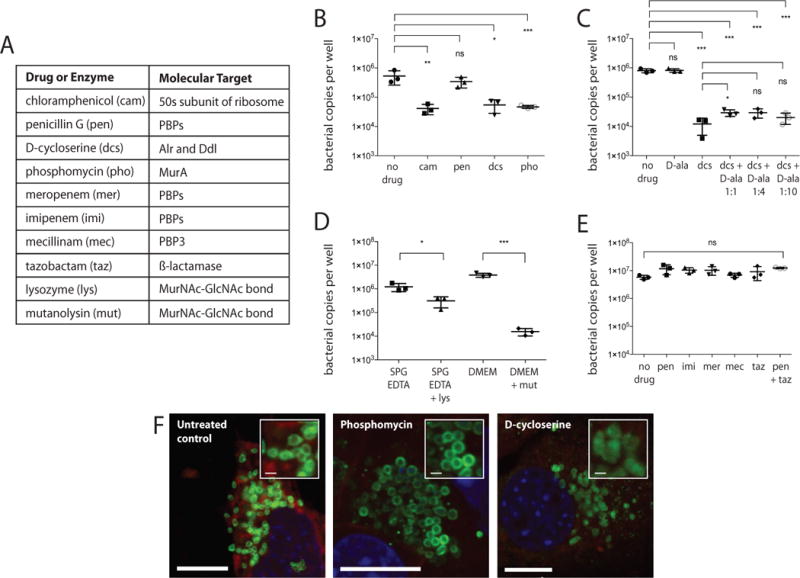
Figure 4. O. tsutsugamushi treated with cell wall-targeting drugs.

A. Table showing the molecular target of drugs and enzymes used in this study. B-E. Bacterial copy number per well of a 24-well plate after 7 days growth in the presence of different drugs. Three replicate wells were used in each experiment. Graph shows each individual data point, as well as the mean and standard deviation. Statistical significance was determined using an unpaired t test analysis. P values are illustrated as follows: ns (P > 0.05); * (P ≤ 0.05); ** (P ≤ 0.01); *** (P ≤ 0.001). F. Immunofluorescence microscopy of intracellular O. tsutsugamushi cells treated with 40 μg/ml phosphomycin or 250 μg/ml D-cycloserine for 24 hours. Bacteria are labelled in green (using anti-TSA56 antibody); host cytoplasm in red (Evans blue) and nuclei in blue (DAPI). Scale bar = 10 μm (large images) or 1 μm (insets).
