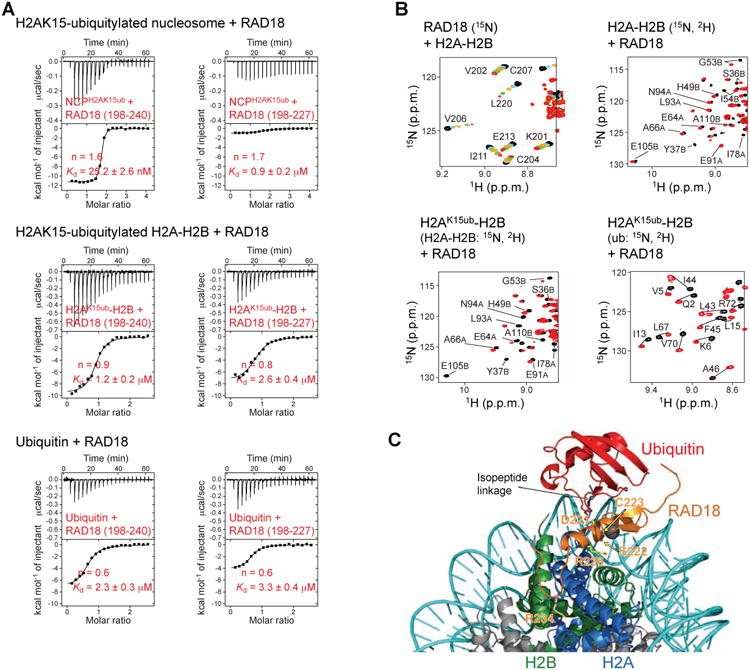
Figure 7. Interaction of RAD18 with the nucleosome ubiquitylated at H2AK15.

(A) ITC results for the interactions of RAD18 (aa 198-240; aa 198-227) with ubiquitin and with the NCP and H2A-H2B enzymatically ubiquitylated at H2AK15. n is the stoichiometry of binding. Kds are reported with s.d. determined by nonlinear least-squares analysis.
(B) Regions of 1H-15N TROSY HSQC titration spectra of RAD18, H2A-H2B and H2AK15ub-H2B illustrating the interaction of RAD18 with H2A-H2B and ubiquitin in H2AK15ub-H2B. Different isotope labeling schemes (15N or 15N, 2H) were used as indicated.
(C) Cartoon representation of the NMR-based model of NCPK15ub in complex with RAD18 (aa 198-240). The zinc atom is shown as a gray sphere. Side chains of RAD18 for which NMR signals were most affected (i.e. exchange broadened) by interaction with H2A-H2B are shown in yellow sticks. RAD18 R234 side chain interacting with H2A-H2B acidic patch is also shown.
