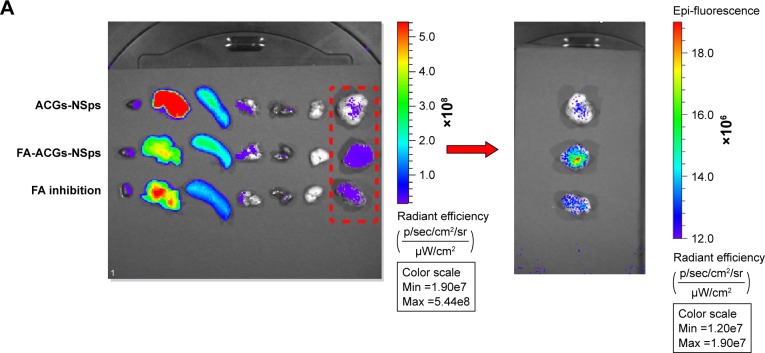
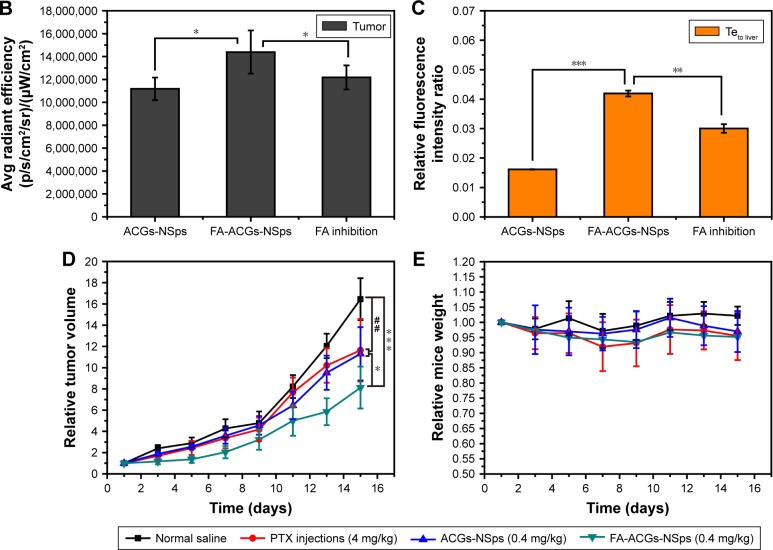
Figure 7.
In vivo experiments on 4T1 tumor bearing mice.
Notes: (A) The distribution of ACGs-NSps, FA-ACGs-NSps, and FA-ACGs-NSps in the FA inhibition group in the major organs of 4T1 tumor bearing mice at the end of the experiment (from left to right: heart, liver, spleen, lung, kidney, brain, and tumor). (B) Average fluorescence intensity in tumors of three groups at the end of the experiment. (C) The ratio of the fluorescence intensity in tumor to the fluorescence intensity in liver (Teto liver) of three groups at the end of the experiment. (D) The growth of relative tumor volume over time in the in vivo antitumor efficacy of PTX injections, ACGs-NSps, and FA-ACGs-NSps. (E) Relative mice body weight change with time. All data are represented as mean ± SD. *P<0.05, **P<0.01, ***P<0.001 with FA-ACGs-NSps; ##P<0.01 with normal saline.
Abbreviations: ACGs-NSps, Annonaceous acetogenins nanosuspensions; Avg, average; FA, folic acid; FA-ACGs-NSps, folic acid-modified Annonaceous acetogenins nanosuspensions; DiR, 1,1′-dioctadecyltetramethyl indotricarbocyanine iodide; PTX, paclitaxel; SD, standard deviation.


