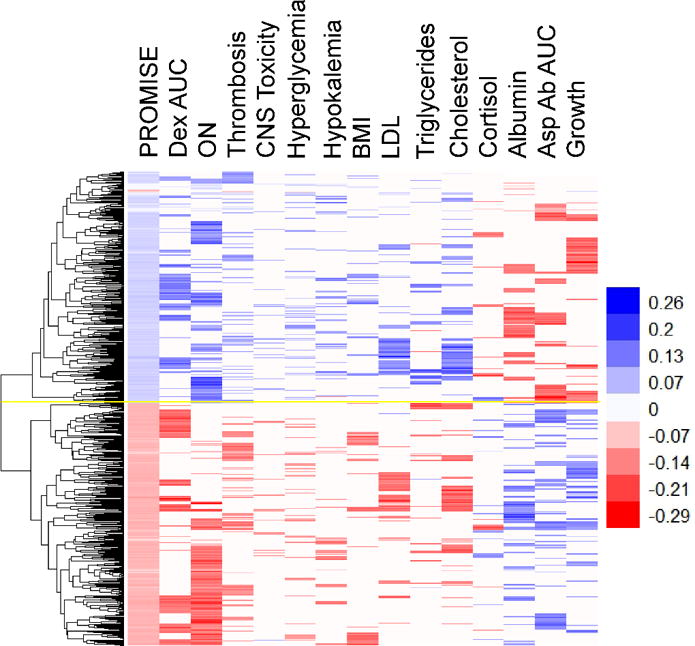
Figure 2.

Heat map of 610 PROMISE SNPs (with p<7.3×10⁻⁴), selected as significant in the PR14 analysis (see Materials and Methods for details). Each row is a SNP (n=610) and each column is a phenotype. Associations of SNP variants with the indicated phenotype with p<0.05 are shown in color, with red indicating an effect size of less than one and blue indicating an effect size greater than one. SNPs with similar associations across phenotypes are clustered by the dendogram at left. Yellow line indicates separation of negative associations (bottom) and positive associations (top). PROMISE (Projection onto the Most Interesting Statistical Evidence) statistic. ON, osteonecrosis. CNS, central nervous system toxicity. Growth, decreased growth trajectory. BMI, body mass index. Asp Ab AUC, asparaginase antibody area under the curve. LDL, concentration of low density lipoproteins in serum. Dex AUC, plasma dexamethasone area under the curve (week 7). See Supplemental Digital Content Table 1, Supplemental Digital Content Figure 5, and the Materials and Methods section for more details on each phenotype.
