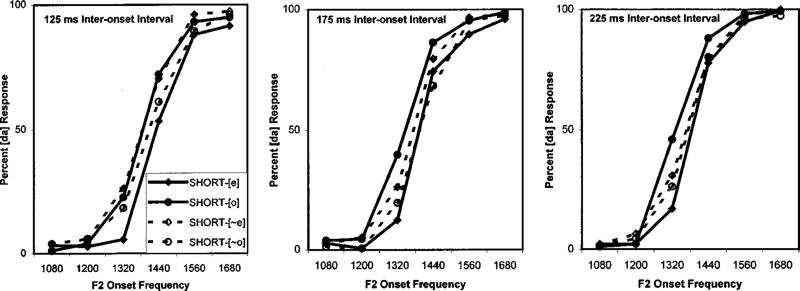
FIG. 3.
Data from identification (/b/,/d/) task in experiment 2 for very short (25-ms) precursors and three interonset intervals. Percent /da/ responses as a function of second formant onset frequency are plotted by precursor type. Solid lines indicate data for three-peak short-[e] and short-[o] precursors, and data from spectral complement short-[~e] and short-[~o] precursors are shown with dashed lines.

