
Figure 3.
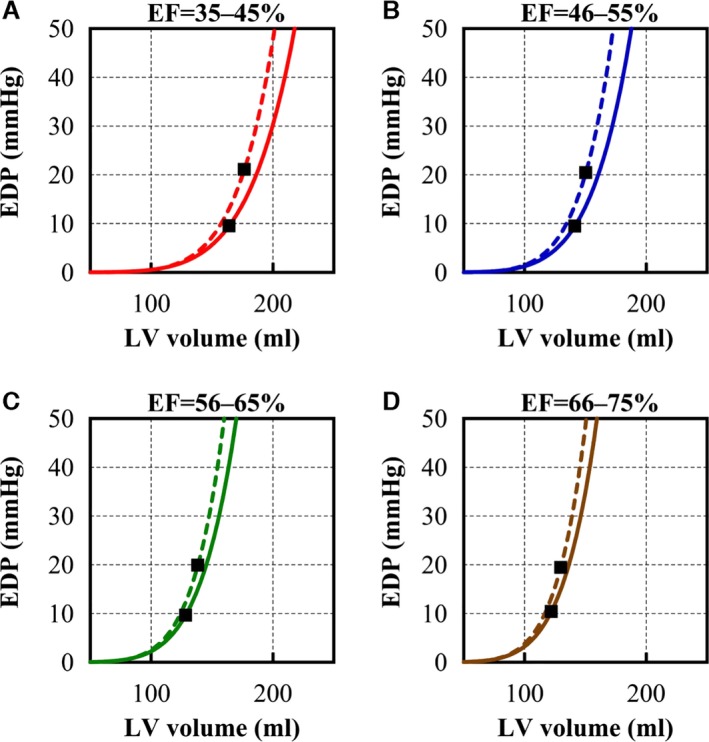
Calculated EDPVRs and single sets of (mean EDV, mean EDP). Calculated EDPVRs and single sets of (mean EDV, mean EDP) are plotted (squares) in (A through D). Solid lines indicate EDPVRs of normal EDP subgroups and dashed lines indicate EDPVRs of elevated EDP subgroups. In lower EF groups, EDVs are larger than that of higher EF groups. EDPVRs from elevated EDP subgroups are shifted upward compared to EDPVRs from normal EDP subgroups. EDP indicates end‐diastolic pressure; EDPVR, end‐diastolic pressure–volume relationship; EDV, end‐diastolic volume; EF, ejection fraction; LV, left ventricular.