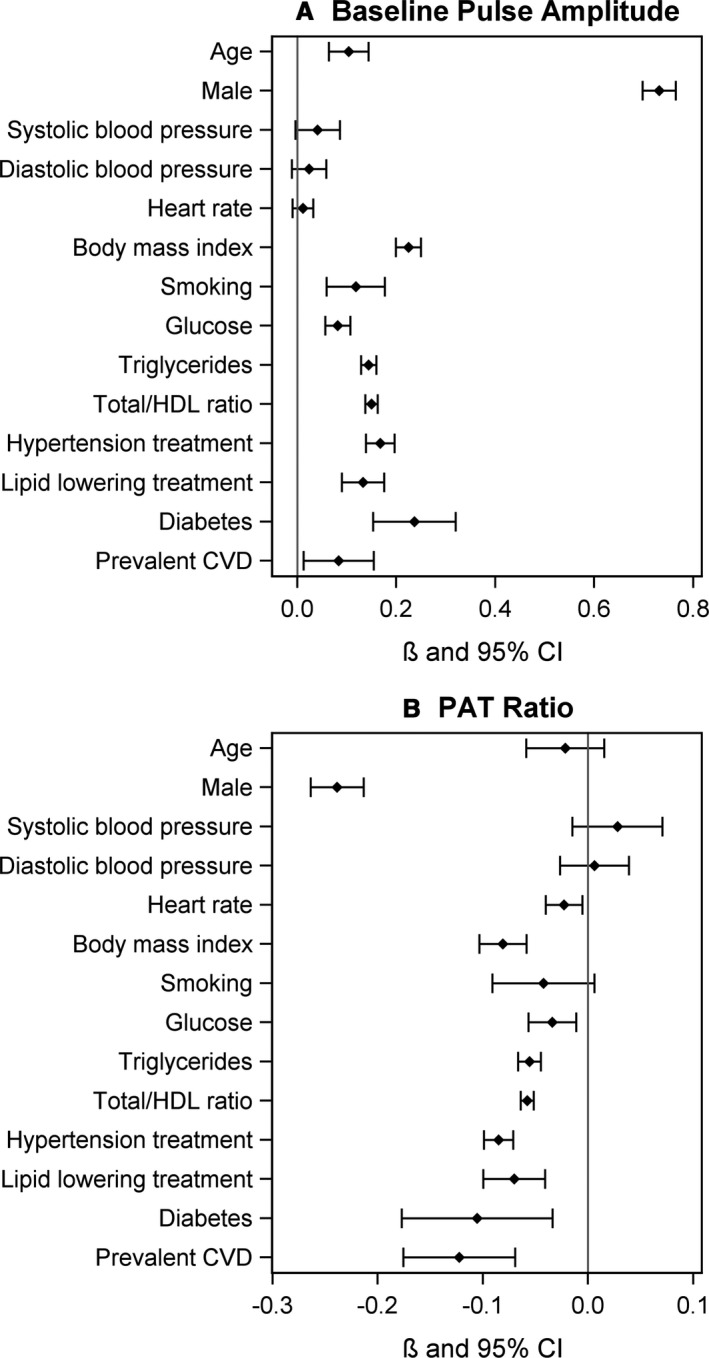
Figure 1.

Forest plots of clinical correlates of digital vascular measures across the 3 cohorts. A, Baseline pulse amplitude. B, PAT ratio. Data were age‐ and sex‐adjusted. Per SD on continuous variables. Combined estimate using DerSimonian and Laird random effects model. Q test for heterogeneity. CVD indicates cardiovascular disease; HDL, high‐density cholesterol; PAT, peripheral arterial tonometry.
