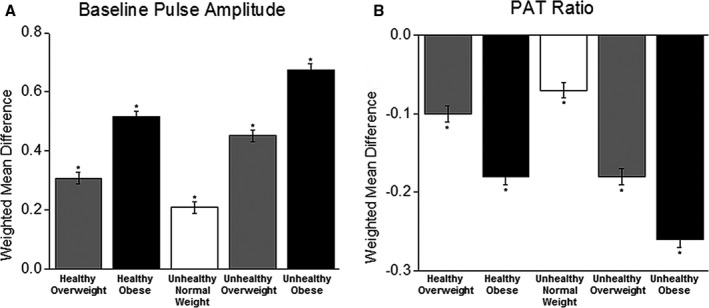
Figure 2.

Meta‐analysis of digital vascular measures by metabolic and body mass index categories. A, Baseline pulse amplitude. B, PAT ratio. Data are shown as weighted mean difference compared with metabolically healthy normal‐weight person (reference). Data were age‐ and sex‐adjusted. *P<0.0001 compared to normal weight metabolically healthy. Baseline pulse amplitude and PAT ratio are unitless. PAT indicates peripheral arterial tonometry.
