Figure 1.

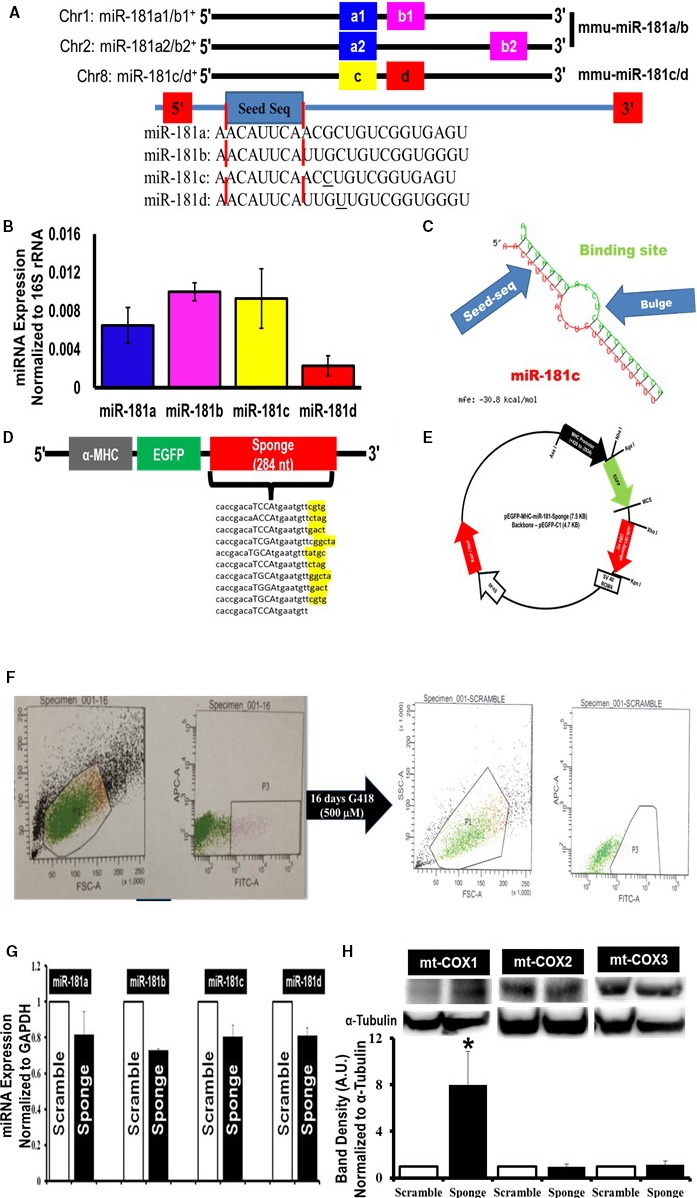
Mitochondrial localization of microRNA‐181 (miR‐181) family and miRNA‐family‐wide knockdown strategy. A, Schematic depiction of mouse miR‐181 family. Two independent paralog transcripts of miR‐181a/b precursors—miR‐181a1/a2 (blue) and miR‐181b1/b2 (pink). The names of the mature miRNAs are denoted in the boxes. The blue box with “seed” labels in the box highlights the conserved sequence among all 4 mature miR‐181, indicated inside the red dotted lines. B, Quantitative polymerase chain reaction (qPCR) (SYBR kit) analysis of miR‐181 family (a, b, c, and d) expression in total RNA from the mitochondrial pellets of C57BL6/J mouse hearts. The miRNA expression was normalized to mitochondrial 16S rRNA. C, Predicted structure of miR‐181 sponge and miR‐181 family. The red side of this structure is miR‐181 family, in this particular case miR‐181c. The green side is 1 of the 10 transcripts of miR‐181 sponge. The binding site shows the antisequence of the seed sequence of miR‐181. The bulge formation gives stability to the structure. The energy required for the stability of this structure is −30.8 kcal/mol. D, Design of an EGFP (enhanced green fluorescent protein) expression construct under the regulation of a heart‐specific promoter, α‐myosin heavy chain (α‐MHC) and containing either the miR‐181 sponge construct (sponge) or scramble sequence (scramble, not shown). The 4 nucleotides indicated with capital letters immediately after the anti‐miR‐181 seed sequence are the spacer, and nucleotides highlighted in yellow after each of the 9 anti‐miR‐181 sequences are the spacer between each anti‐miR‐181 seed sequence. E, Cardiospecific miR‐181 sponge vector map. F, Generation of cardiospecific miR‐181‐sponge‐H9c2 and cardiospecific scramble‐H9c2 from single‐cell clones. Gate P3 in the left part of F represents the green fluorescent protein–positive (GFP +) H9c2 cells, only 8.2% of total number of H9c2 cells, which were sorted and cultured for another 16 days with G418. Gate P3 in the right part of F represents GFP + H9c2 cells, 60% of the total number of cells, which were again sorted and seeded at 5 to 10 cells/well of a 96‐well plate. G, Quantitative PCR data examining miR‐181 family expression in the stable miR‐181‐sponge‐H9c2 (sponge) and the scrambled‐sponge H9c2 (scramble) cells. A slight decrease of the entire miR‐181 family, miR‐181a, b, c, and d, was decreased in the EGFP‐miR‐181‐sponge–expressing group, compared to EGFP‐miR‐181‐scramble‐H9c2 cells. We normalized the data to the GAPDH expression. H, Western blot analysis of mitochondrial cytochrome c oxidase (mt‐COX) expression in miR‐181‐sponge and scramble‐sponge H9c2 cells. The mt‐COX1 (upper band, left side), mt‐COX2 (upper band, in the middle) and mt‐COX3 (upper band, right side) expression was normalized to α‐tubulin (lower bands). Bar graphs show the quantification of protein expression. Protein lysate was prepared from the whole cell pellets. *P<0.05 vs scramble (n=3).
