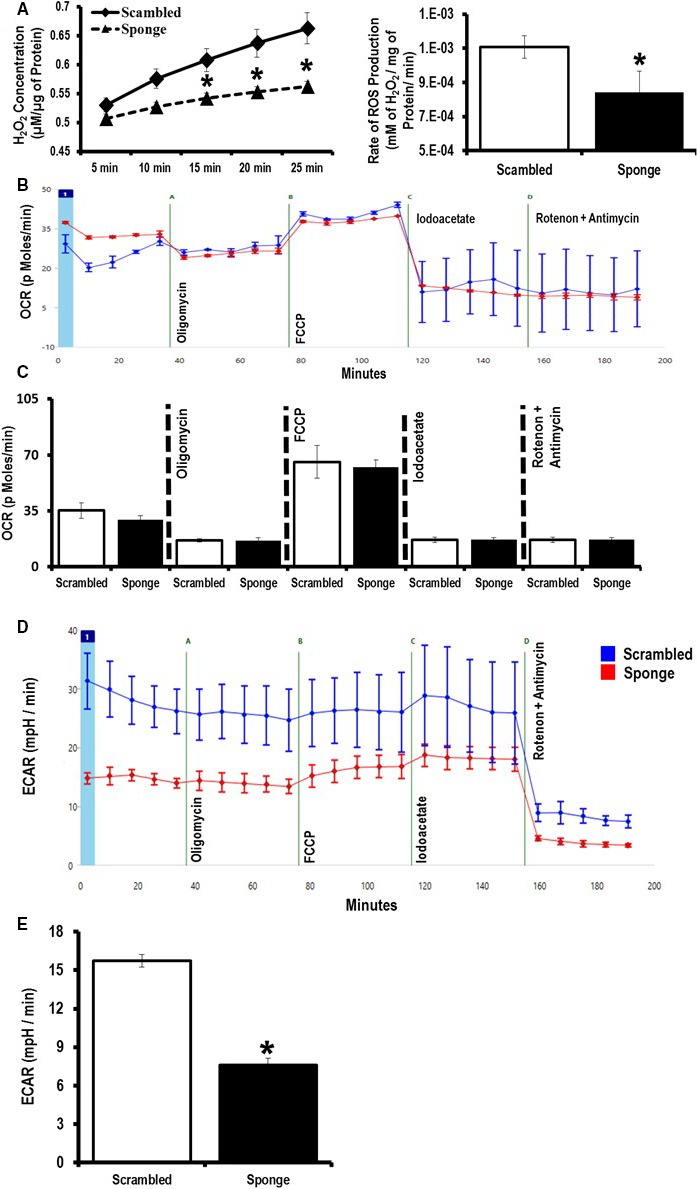
Figure 2.

Effect of microRNA (miR)‐181‐sponge on mitochondrial function and cellular metabolism. A, Measurement of H2O2 production as an indicator of reactive oxygen species (ROS) generated from the miR‐181‐sponge and scrambled sponge H9c2 cell lines. B, Representative trace for the mitochondrial O2 consumption rate (OCR). C, Analysis of OCR under basal and after addition of oligomycin, carbonilcyanide p‐triflouromethoxyphenylhydrazone (FCCP), iodoacetate, and rotenone/antimycin in miR‐181‐sponge compared to scramble‐expressed H9c2 cells. D, Representative trace for extracellular acidification rates (ECAR). E, Analysis of glycolysis using ECAR, in miR‐181‐sponge compared to scramble‐expressed H9c2 cells. *P<0.05 vs scramble (n=8).
