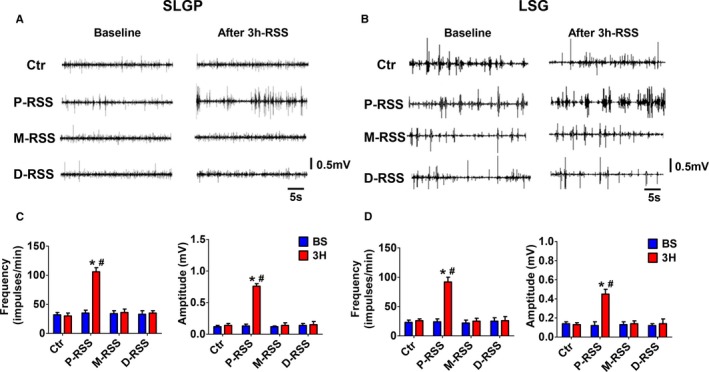
Figure 4.

Representative examples (A and B) and quantification analysis (C and D) of autonomic neural activity in 4 groups. A and C, Neural activity in superior left ganglionated plexi (SLGP). (B and D, neural activity in left stellate ganglion (LSG). BS indicates baseline; Ctr, control; D‐RSS, distal RSS; M‐RSS, middle RSS; P‐RSS, proximal RSS; RSS, renal sympathetic stimulation. *P<0.05 vs baseline (BS); # P<0.05 vs other 3 group at the same time point.
