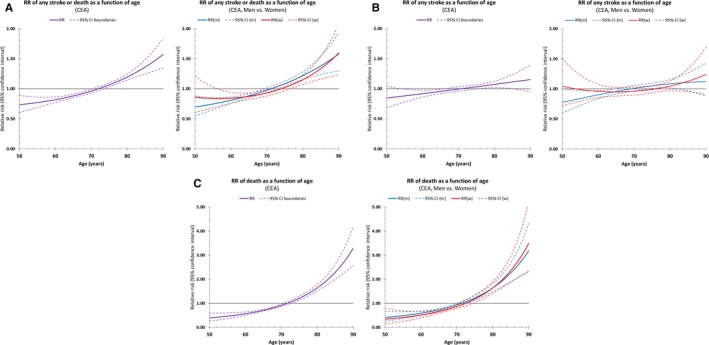
Figure 4.

Relative risks as a function of age for (A) any in‐hospital stroke or death, (B) any stroke, and (C) all‐cause death alone (please note differing range of the y‐axis). Dotted lines indicate the 95% CI. CEA indicates carotid endarterectomy; m, men; w, women.
