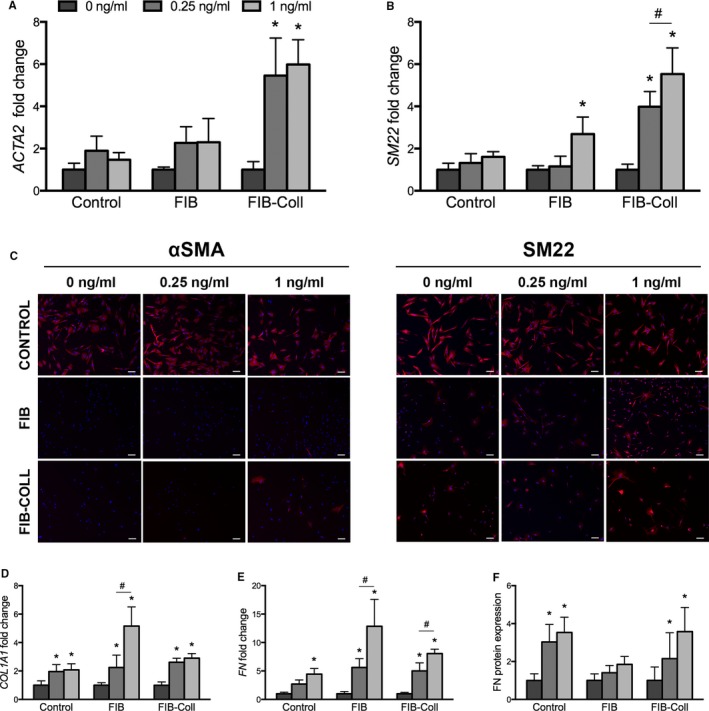
Figure 7.

VICs raised in FIB‐Coll culture respond more strongly to TGF‐β1 treatment than VICs raised in FIB and control culture. Myofibroblastic marker and ECM expression were also analyzed in response to TGF‐β1 treatment. The extent of VIC activation was evaluated through gene expression analysis of (A) ACTA2 and (B) SM22 and (C) immunofluorescent staining for αSMA and SM22. Red indicates positive staining for each marker; nuclei are counterstained blue. Scale bar represents 100 μm. ECM production was assessed through quantitative reverse transcriptase–polymerase chain reaction for (D) COL1A1 and (E) FN, as well as an in situ ELISA for (F) fibronectin protein deposition. *P<0.01 compared with 0 ng/mL in the same condition (control, FIB, or FIB‐Coll). # P<0.01 for comparison indicated on graph. n=6. αSMA indicates α‐smooth muscle actin; ECM, extracellular matrix; FIB, fibroblast media formulation; FIB‐Coll, fibroblast media formulation with culture on collagen coatings; SM22, smooth muscle protein 22‐α; TGF‐β1, transforming growth factor β1; VIC, valvular interstitial cell.
