
Figure 1.
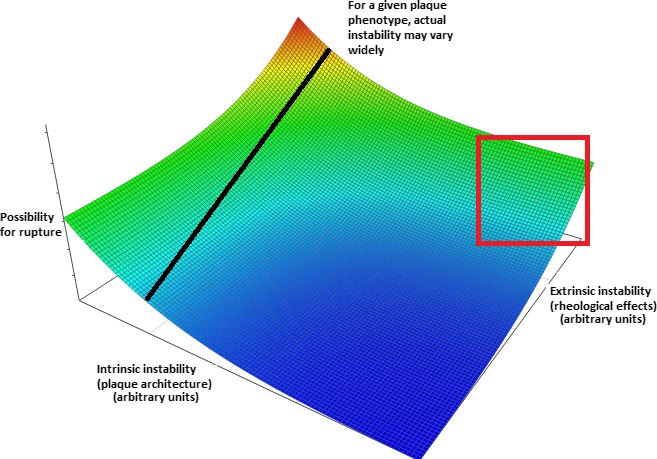
Inadequacy of modern approaches to detect plaque vulnerability. Conceptual plot visualizing the combined effects of factors leading to intrinsic and extrinsic plaque instability. Arbitrary “instability units” are used and the precise form of the relationship is purely conjectural—however, it was chosen to denote the more‐than‐additive effect of simultaneous increases in both parameters. The line drawn corresponds to plaques with a specific internal architecture and demonstrates that their actual instability (ie, possibility for rupture) is also critically dependent on external stresses applied to them. Of note, solely intrinsic features may indeed determine a truly destabilization‐prone plaque, but only at extreme values (thus clinically yielding high specificity and low sensitivity as potential criteria). Furthermore, imaging modalities rarely assess all features of vulnerability (in the current sense)—rather, they focus on specific aspects, such as lipid and calcium content, thus failing in even establishing the value in the intrinsic instability axis. Moreover, both these parameters vary with time given the (1) tendency of plaques to alternate between different structural phenotypes and (2) possibility for alterations in the rheological (dynamic pressure, pressure head, and viscosity) features of circulation (eg, following removal of an upstream lesion through successful angioplasty)—thus, a given plaque's position would not remain fixed on the plot. Clustering could be anticipated to occur in several areas of the plot, given that, often, intrinsic features affect extrinsic and vice versa (ie, a thick‐capped fibrous occlusive plaque would be subject to higher external stresses and thus usually be located in the area enclosed by the red square). Models incorporating all mentioned aspects would likely yield a much more accurate prediction regarding possibility for rupture and (should further parameters such as viscosity be added) acute events (even if silent) and thus guide treatment. Color coding: blue, red: minimal and maximal instability, respectively.