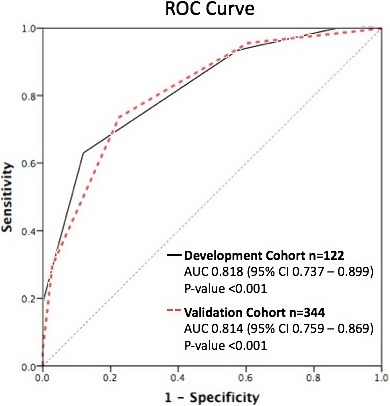
Figure 3.

Receiver operating characteristic (ROC) curves for favorable neurologic outcome in development and validation cohorts. ROC curves for predicting favorable neurologic outcome in both the uncensored development (solid black) and validation (dotted red) cohorts, demonstrating similar c‐statistics of 0.82 and 0.81, respectively. AUC indicates area under the curve.
