
Figure 4.
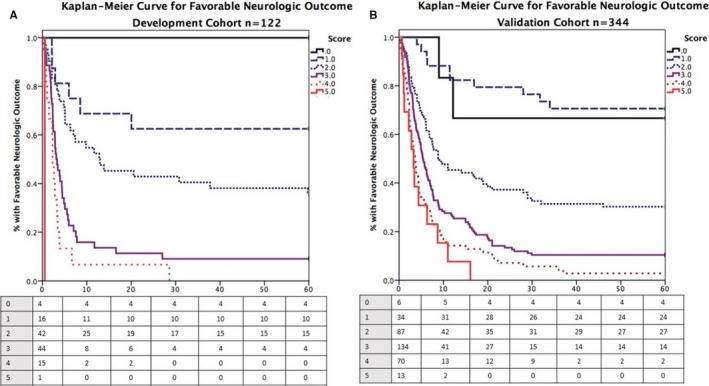
Kaplan–Meier curves of favorable neurologic outcomes at discharge stratified by C‐GRApH score. Kaplan–Meier curves for favorable neurologic outcome at hospital discharge stratified by C‐GRApH score for the development (A) and validation (B) cohorts. Striking similarities exist except at C‐GRApH score 0, a difference attributable to sample size variation between cohorts.