
Figure 2.
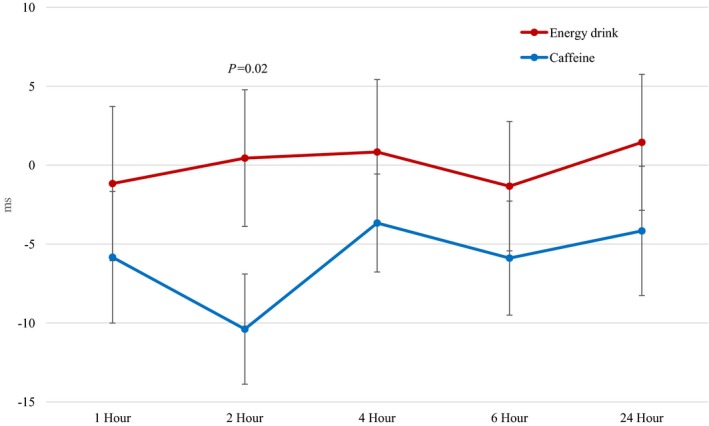
Baseline‐adjusted corrected QT interval with energy drink vs caffeine consumption (0.44±18.4 ms vs −10.4±14.8 ms at 2 hours, respectively; P=0.02). Data are reported as mean±standard error bars.
Official websites use .gov
A
.gov website belongs to an official
government organization in the United States.
Secure .gov websites use HTTPS
A lock (
) or https:// means you've safely
connected to the .gov website. Share sensitive
information only on official, secure websites.
Baseline‐adjusted corrected QT interval with energy drink vs caffeine consumption (0.44±18.4 ms vs −10.4±14.8 ms at 2 hours, respectively; P=0.02). Data are reported as mean±standard error bars.