
Figure 2.
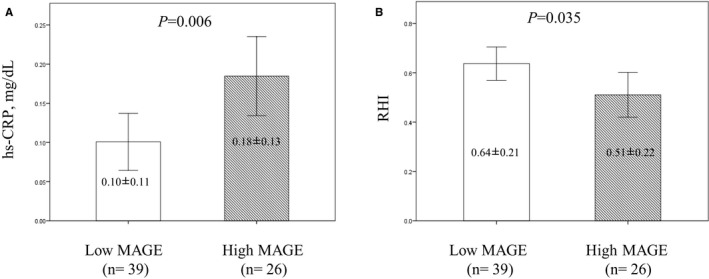
High‐sensitivity C‐reactive protein (hs‐CRP) and reactive hyperemia index (RHI) between the patients with low mean amplitude of glycemic excursion (MAGE) and high MAGE. A, There was a significantly higher hs‐CRP value in the high MAGE group than in the low MAGE group. B, There was a significantly lower mean RHI value in the high MAGE group than the low MAGE group. Data are expressed as mean±SD.