
Figure 4.
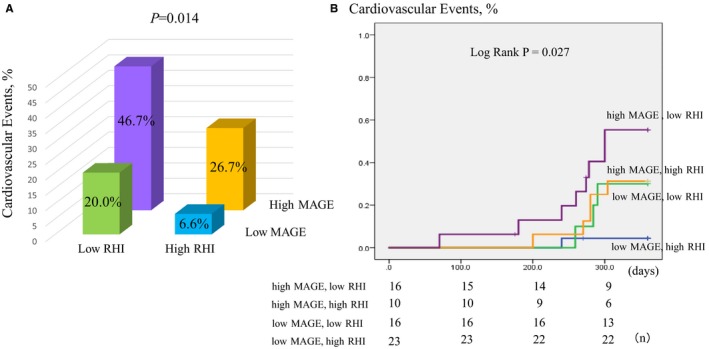
Comparison among the 4 groups by combination with mean amplitude of glycemic excursion (MAGE) and reactive hyperemia index (RHI) for cardiovascular events. A, There was a significantly higher incidence of cardiovascular events in the high MAGE and low RHI groups than the other groups. B, Kaplan–Meier analysis for the cardiovascular events based on the combination with a MAGE value of 65 mg/dL and median RHI value of 0.56.