
Figure 5.
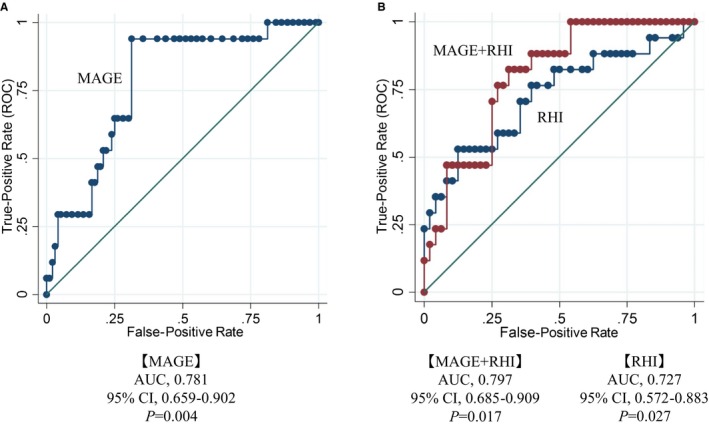
Receiver operating characteristic (ROC) curve for cardiovascular events in mean amplitude of glycemic excursion (MAGE), reactive hyperemia index (RHI), and MAGE+RHI. A, MAGE was a risk factor associated with cardiovascular events. B, Each RHI and MAGE+RHI was a risk factor associated with cardiovascular events. Dates were adjusted by hypertension. AUC indicates area under the curve.